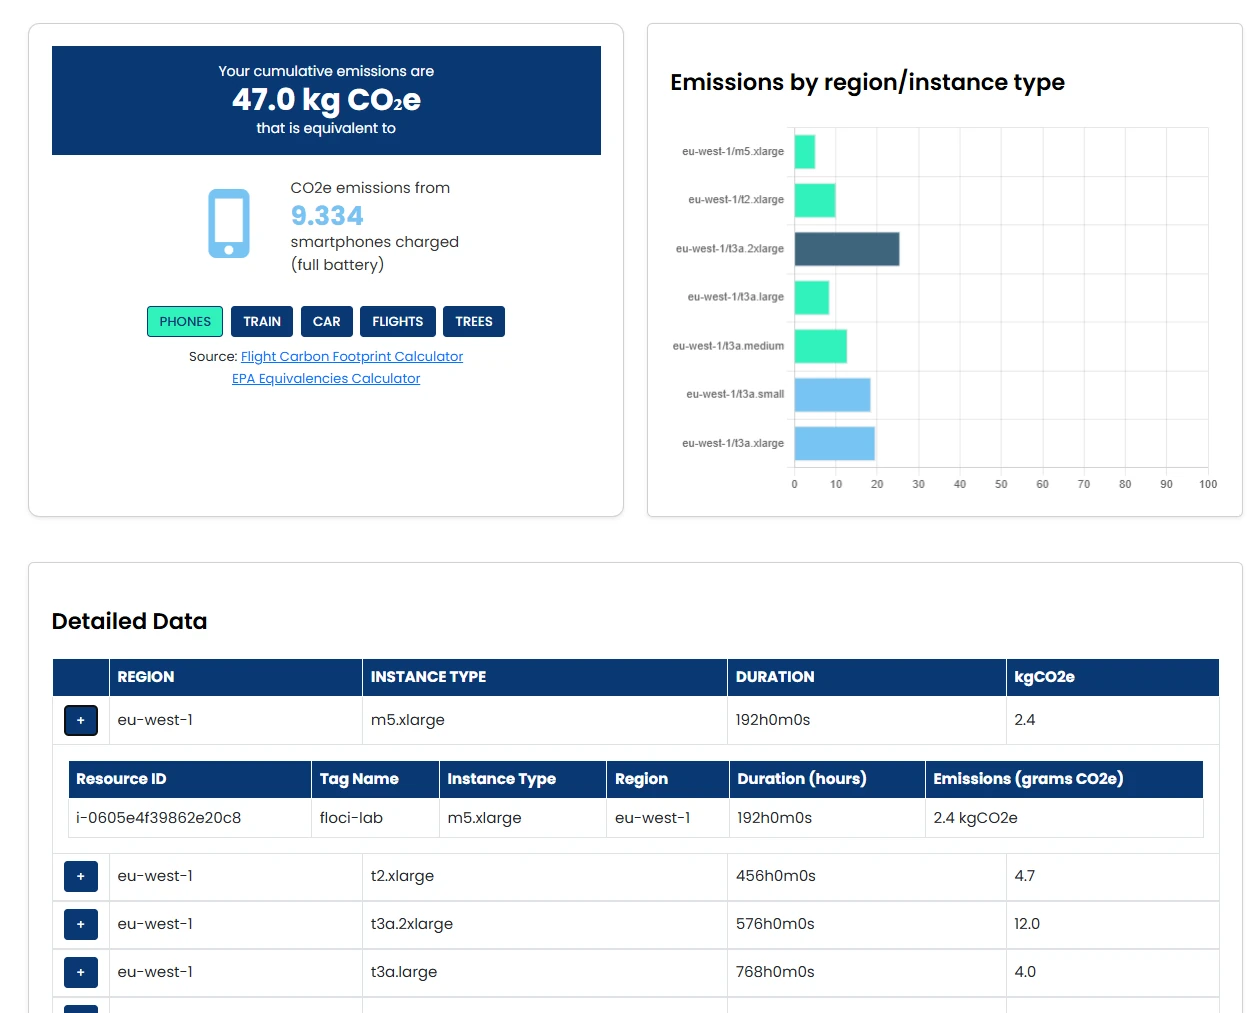
Explore energy use and carbon emissions over time. Understand how your infrastructure contributes to the overall picture and where it is changing.
Energy consumption and carbon emissions
Visibility into changes over time
Context for sustainability reporting
Emissions by region.
kg CO2e
42
28
18
12
Region ARegion BRegion CRegion D
Illustrative example. Not live customer data.
Find where efficiency
can make a difference.
Look into the contribution of individual resources and regions. Use that context to investigate inefficiencies and guide conversations about a more efficient cloud.
Resource and regional breakdowns
Investigation of infrastructure inefficiencies
A connection between operational and environmental decisions
What is driving our cloud footprint?
A practical route from understanding your infrastructure to deciding what to do next.
01
Understand the trend.
Explore how energy use and emissions evolve over time.
02
Investigate the detail.
Review the contribution of resources and regions.
03
Inform the next decision.
Use the findings to support efficiency work and sustainability reporting.
Bring your environmental impact into view.
Explore Korai with a demo focused on your infrastructure and your priorities.