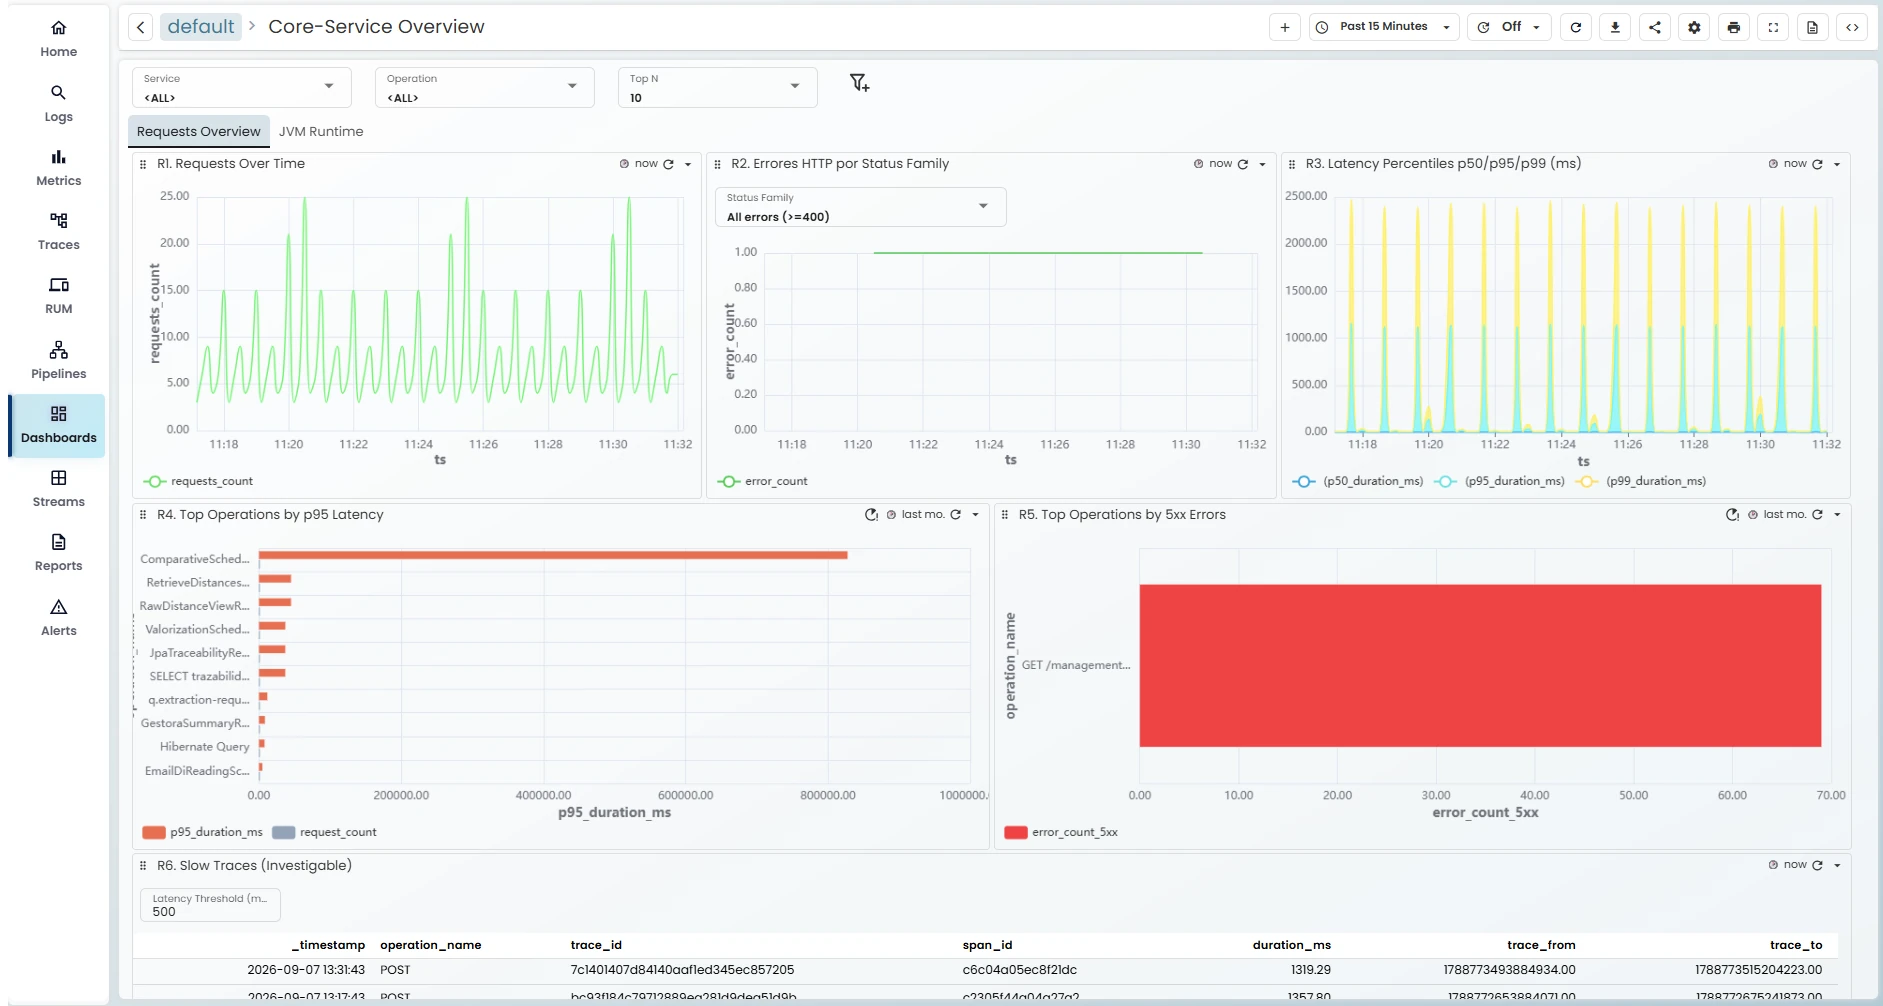
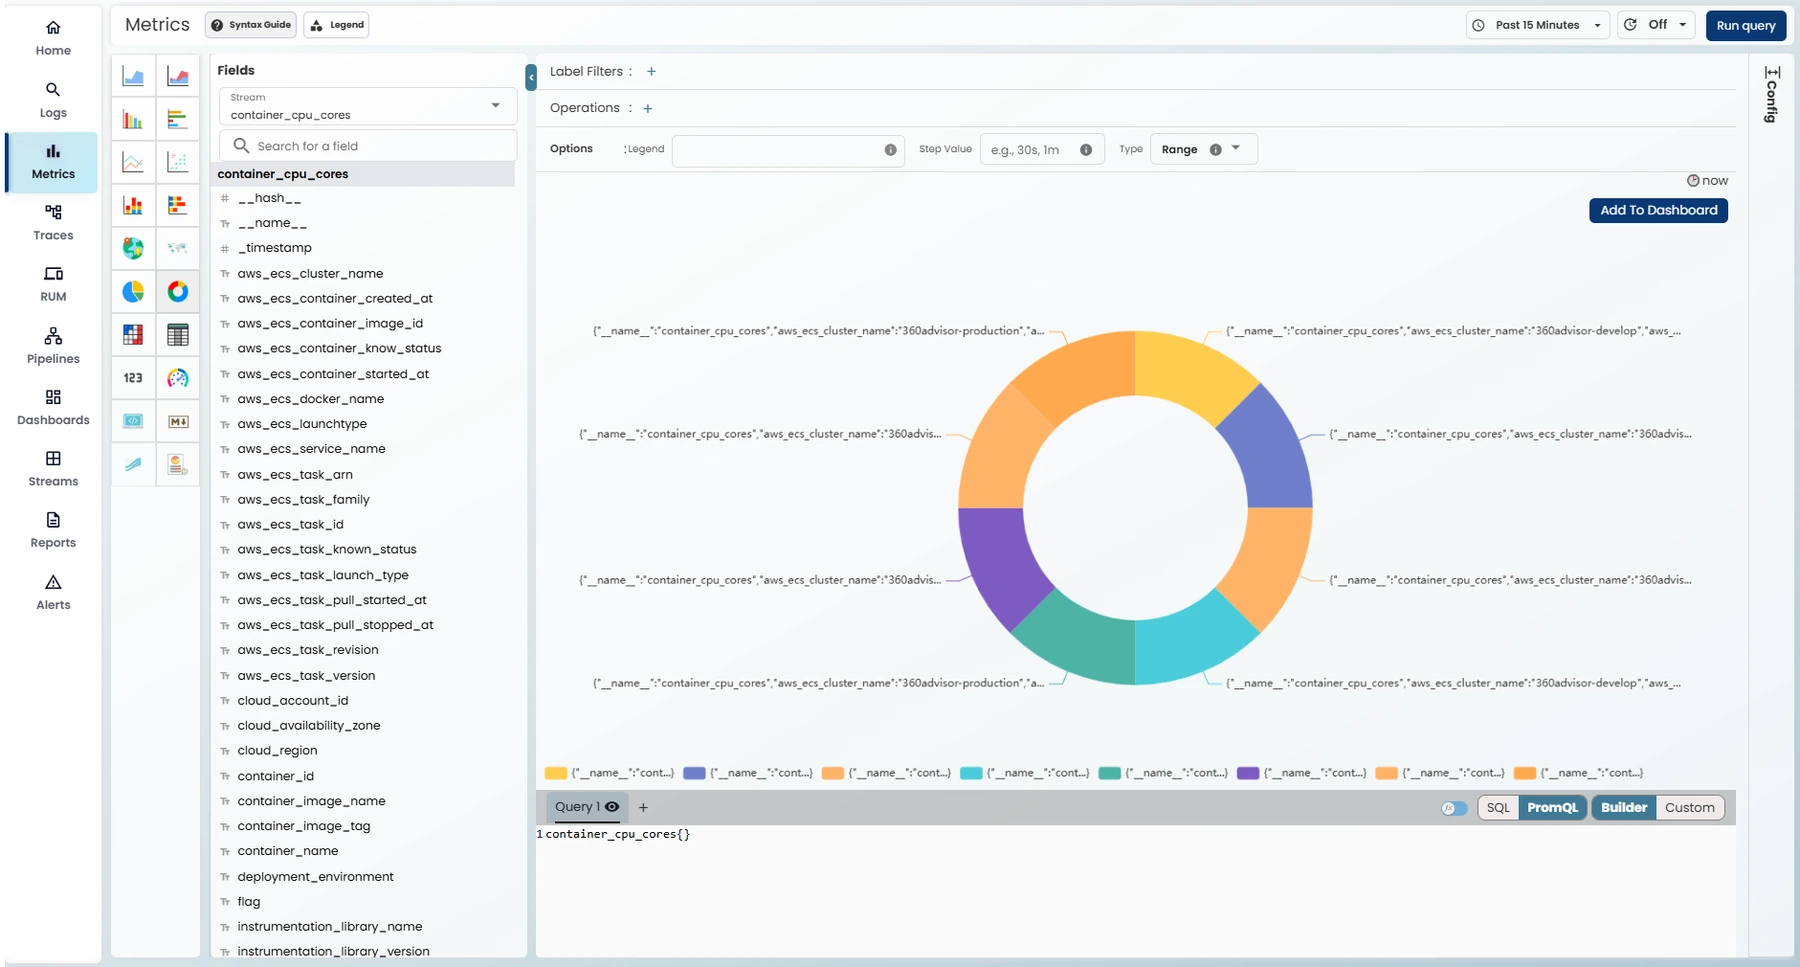
Explore application performance and follow requests into the operations behind them. Locate bottlenecks and slow database queries with the context your investigation needs.
Application and infrastructure visibility
Configurable technical and business dashboards
A deeper view of performance trends
One request, step by step.
120 ms
Gateway
20 ms
Application
35 ms
Database
65 ms
0 ms60120 ms
Illustrative example. Not live customer data.
An error is a starting point.
Not the whole story.
Follow the request, understand how an error propagated and use an explained remediation plan to guide your next investigation.
See the operations involved and where the error appears.
02
Understand the failure.
Read an explanation of the error and its propagation.
03
Investigate the next step.
Use suggested remediation steps to focus your analysis.
Different signals.
One investigation.
A metric reveals a change. A log adds detail. A trace follows the journey. Korai brings these signals into the same product so your team can investigate with context.
Metrics for trends and anomalies
Logs for event-level detail
Traces for request-level investigation
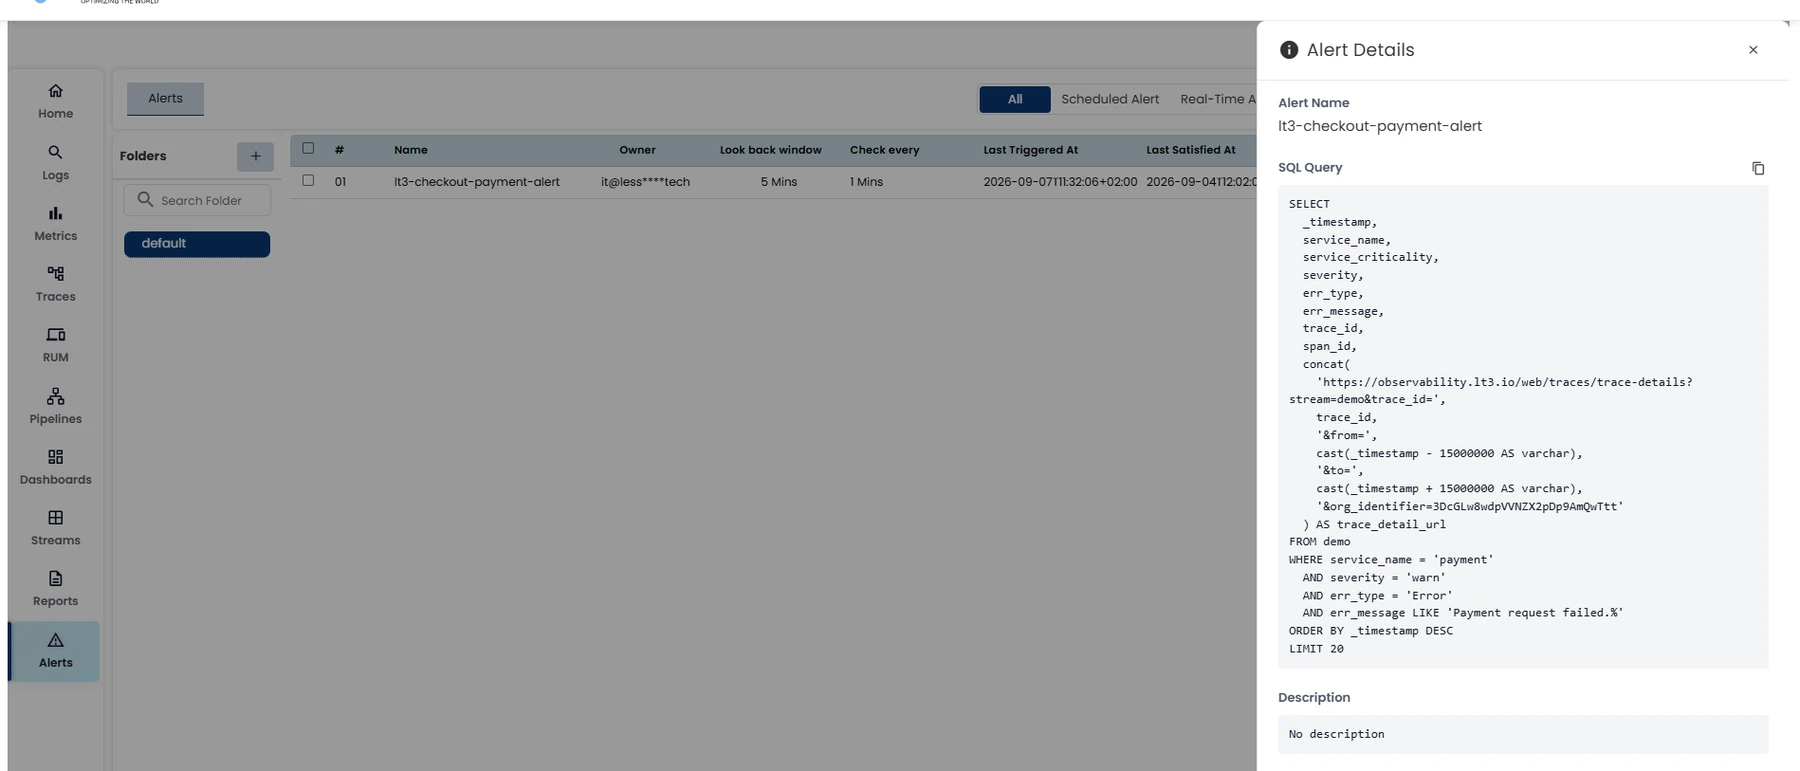
Bring changes to your team’s attention.
Review alerts alongside the telemetry that helps explain them. Move from noticing a change to investigating what is behind it.
Why has this request slowed down?
A practical route from understanding your infrastructure to deciding what to do next.
01
Spot the change.
Use your application view and metrics to find the period or service that needs attention.
02
Follow the request.
Inspect traces and queries to see which operations contribute to the delay.
03
Investigate with context.
Use logs and explanations to guide the next technical action.
Go deeper into your application performance.
Explore Korai with a demo focused on your infrastructure and your priorities.